


The Barents Sea winter survey
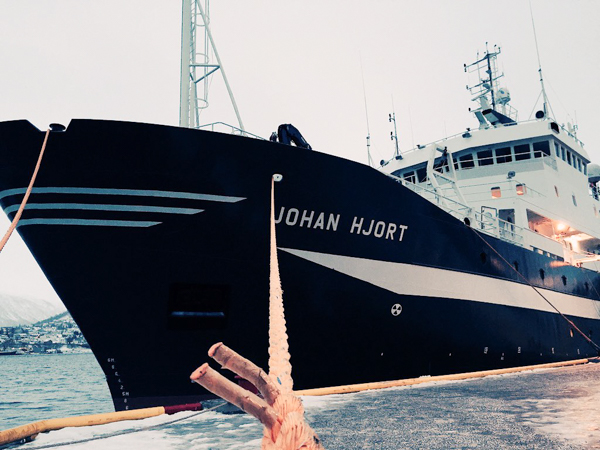
The research vessel ‘Johan Hjort’ in Tromsø harbour at the start of the 2016 wintersurvey of the Barents Sea
Mid-winter in the arctic is not the season when going to sea is most tempting. It’s dark 20 hours a day, ice-cold, bad weather, frequent storms, and altogether rather miserable. For the fish this doesn’t matter, and in January and February the large bottom-dwelling fishes like cod, haddock and saithe prepare for their annual spawning season. The fish congregate, making it easier for fisheries biologist to go out to sea and survey the extent and size of these fish stocks. Therefore, for us fish biologists working with cod, saithe and haddock, winter is the season when it is easiest to survey the entire extent of the fish stocks.
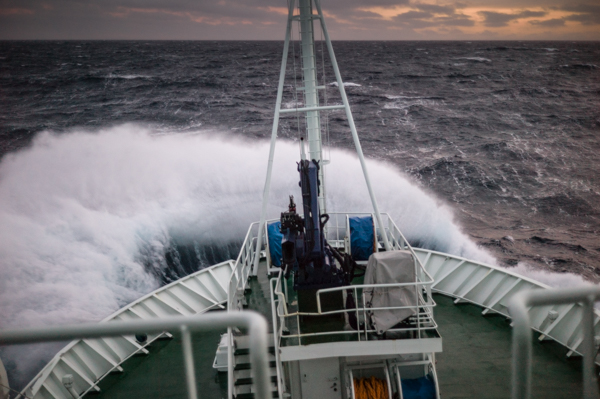
R/V ‘Johan Hjort’ breaking the storm waves heading north in the Barents Sea
This is why I currently find myself onboard the R/V Johan Hjort, a Norwegian research vessel, at 76 degrees N in the Barents sea, one-and-a-half days steaming north of Nordkapp, the northernmost point on mainland Europe. Up here in 2-4 degrees C at depths typically of 250m we systematically survey the sea for fish using a bottom trawl that we tow for 15 minutes at preselected locations. After the survey is finished we and two other vessels (one of them Russian) will have surveyed over 1,5 million square kilometers of the Barents sea, sampling fish at over 350 trawl stations. Measurements of the temperature and salinity of the sea water, as well as acoustic measurements of fish in the water column (using an advanced version of a fish-finder) will together with the trawl catches be used byt my colleagues in the assessment of the sizes of the various fish stocks. This in turn is the basis for projecting how much fish there will be in the sea next year, and hence setting a sustainable quota for the various fisheries in the Barents Sea.
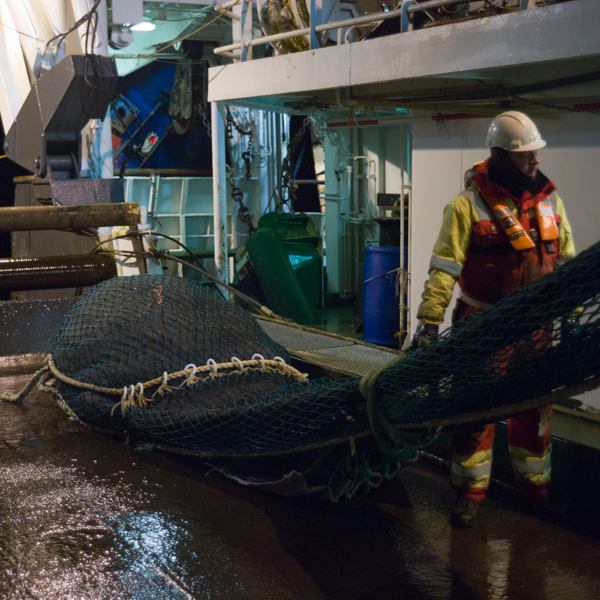
Trawl on deck after a 15 minute demersal (on the sea-floor) haul
So the winter survey in the Barents Sea is the best survey to measure how much fish there is, making it tremendously important for the multi-million-dollar fisheries operating here. The fishing-boats operating in these waters mainly come from Russia and Norway who share the Barents Sea 50-50, but there is also a smalle quota to third-party EU countries. Therefore, our scientific surveys here are of great importance to the fishing-sector of several countries, and all of us who’re on the R/V Johan Hjort and the other research vessels feel that responsibility and strive to deliver.
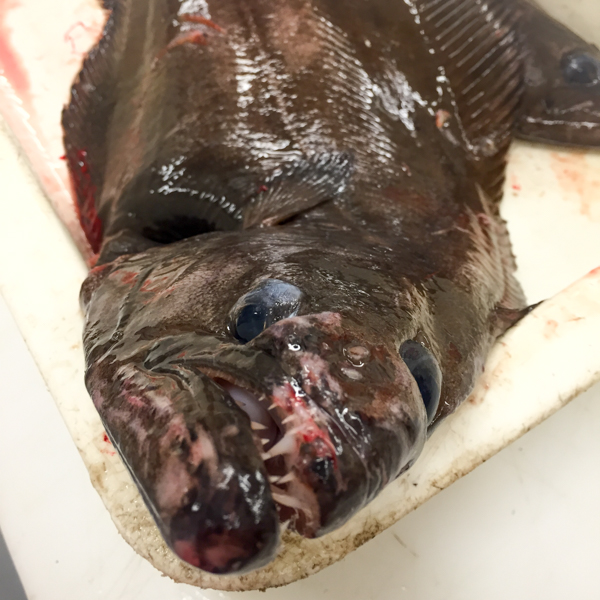
Grinning Greenland hailbut, one of the ugliest, but tastiest fish in the Barents Sea
Much has changed on the survey since the last millennium
This time I’m participating in the survey as an experienced scientist in the role as scientific cruise leader. But I’ve participate before, back in 1999 when I was an inexperienced student looking for a job. The last time I was on the winter survey I was working in the fish lab, sorting and measuring fish. Much has changed since then, although the reasons for carrying out the survey remain essentially the same. In the ’90s we didn’t have a permanent satellite uplink, which we have now and allows me (among other things) to make blog-posts and tweet. Back in 1998 there was no data transfer, and if you needed to contact the mainland a satellite phone charging $5 per hour was your only option. Also, there was not TV or radio, so in the evenings we all got together and played games or talked, now we mostly spend our free time watching TV or surfing the net… Back in 1999 we still used paper an pencil for recording our measurements. All fish were measured manually and their lengths tallied on a sheet of paper which was later entered into a data-based. This was a time-consuming process prone to typos and errors. Today this task is computerised using an electronic length-measuring boards and scales connected to a computer that records the data automatically, quickly and without typos.
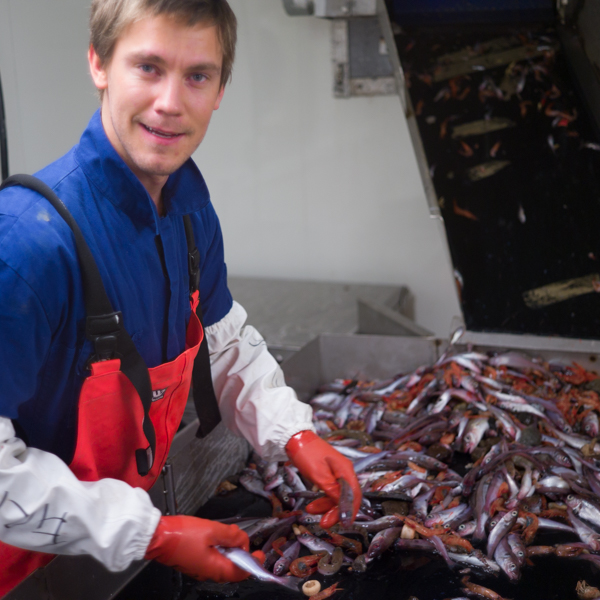
Research technician Eirik Odland sorting a trawl catch of fish and shrimp in the fish lab on R/V Johan Hjort
New technology has definitely made the way we work in the fish lab more efficient, and the time that has been freed up is put to good use. While we in the ’90s only had time to focus on the 8-10 commercially most important fish, lumping the rest of the catch in an ‘other’ group. Since the early 2000’s we’ve classified, measured and recorded everything we get on deck. All the non-commercial fish and shrimps are classified to species, measured and weighed. While we in the previous millennium could get by with a limited taxonomic knowledge, now our technicians are highly trained in species identification of the 250 or so fish species that live in the Barents Sea. They are able to tell them apart based on minute differences in traits like the eye-size, size of the snout, or angle of spikes. This makes the data from the survey valuable in a wider context than just for stock assessment of the commercially most important species. Now we can get better insights into the ecology and species communities in the different regions of the Barents Sea. Such detailed fish data has allowed for our scientists to analyze how climate change has impacted the species distribution in the Barents sea in the past decades.
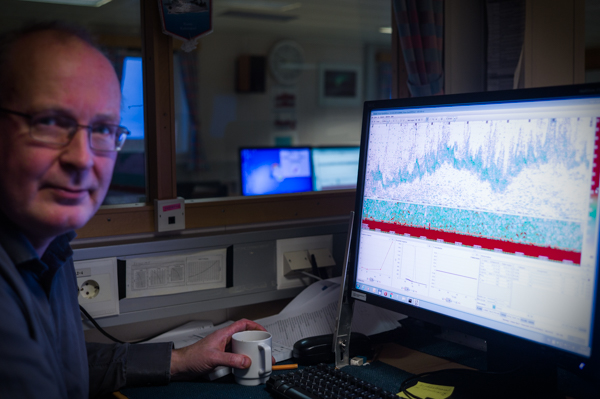
We use echosounders (advanced fish-finders) to continuously record the fish and plankton in the sea between the surface and sea-floor. Here scientist Knut Korsbrekke is examining and interpreting such an echogram covering 5 nautical miles (9.3 km)
The trawl-catches are central to the monitoring and stock assessment, but they only give us information on the fish species composition and density at the bottom in the exact location we were trawling. Using echousounders that continuously send out sound pulses that reflect from plankton and fish in the water column we are able to “see” what is below the research vessel at any given time. This allows us to interpret what species of fish and how much there are at various depths, and in the areas between the trawl stations. Interpreting the acoustic recordings requires skill and experience, where we rely on both the ecco strength, form, location and depth to deduce what is the most species most likely “seen”.
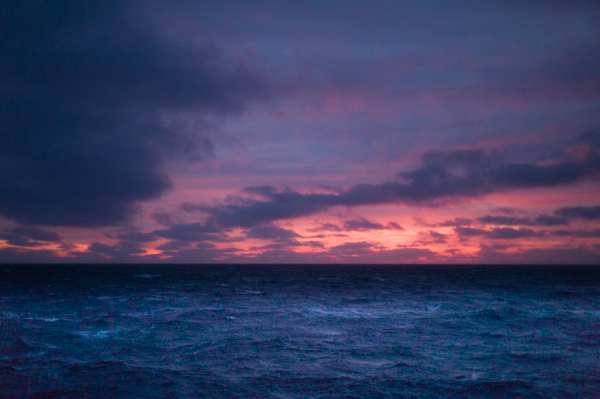
Sunrise (almost, since the sun is still below the horizon) in the Barents Sea